


Google Sheets is a useful tool when it comes to working with data. And when you talk about collaboration, it is really a great tool. Google Sheets has features that make working with data easier.
As data manipulation can be tricky and sometimes difficult, Google Sheets helps with an easy to use interface that seeks to solve this problem.
Charts in exists in Google Sheets to help you present data in a visual format for easy comparison and analysis. One of such charts is Bar Charts. In this guide, we talk about how to Create a Bar Chart in Google Sheets
How to Create a Bar Chart in Google Sheets
Making a bar chart on your sheet will involve you selecting the range of cells you want to create a bar chart for and clicking options that will enable you do that. Here’s how:
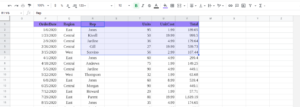
1. Assign data to the chart by dragging and selecting range of cells.

2. Next, navigate to the Insert menu and select Chart.

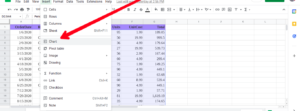
You’ll then see a default chart in your spreadsheet which is a column chart. You can however change it to a bar chart.
To switch to a bar chart, do these:
1. Navigate to the Chart Editor sidebar which you’ll see when the chart appears.
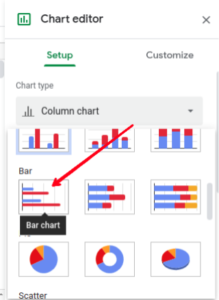
2. Select the Setup tab which is at the top and click the Chart Type drop-down box

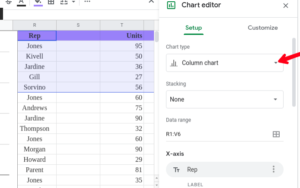
3. Next, go down the drop-down and select the Bar Chart.

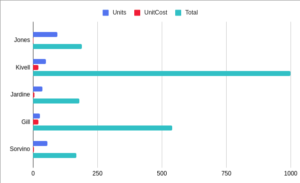
You chart will then be changed to bar chart.

Customize a Bar Graph in Google Sheets
Google Sheets allows you to do Customization on your charts. It has a good bunch of customization option. Parts you can customize in a bar charts are font style, background color and, title.
Here’s how to start customising:
1. Launch the Chart Editor sidebar. Do this by clicking the three dots which you’ll see at the top right of the graph.
2. Next, select Edit Chart.
3. Select the customize tab. It is at the top of the sidebar.

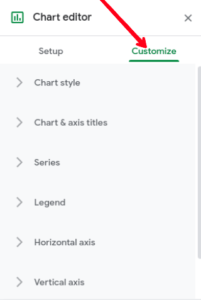
When you do the above, you’ll see your customization options which you can expand and get into customising.
Bar Chart Customization Options
In this section, we’ll explore some important options you can tweak to improve the look of your bar chart.
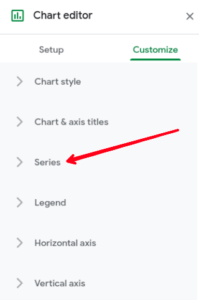
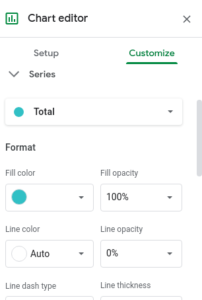
Modify the Series
Google Sheets has default colors for the bars on your chart, but you are allowed to modify them. Here’s how:
1. Open the Series section in the sidebar.

2. Next, click Apply to All Series drop down. This will allow you to select the series you wish to change which you should do.
3. After that, you can change the color. You can also change the opacity. You can do this for both the fill and line.

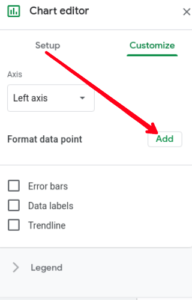
Format a Data Point
If you need to make a specific bar stand out, then formatting the bar is what you need to do. Here’s how to format a bar on Google Sheets:
1. In the Series section below the line options, select Add. Add is beside Format Data Point.

2. You’ll see a pop-up window from where you can specify the the point you want to format. You can do it in two ways: select it from the drop-down list or click it directly from the chart.

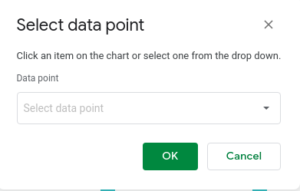
3. A color palette will then appear from where you can pick the color you wish to use and it will reflect in the chart.
Add Error Bars
Google Sheets also allows you to add error bars to your chart. These error bars can be based on value, percentage or standard deviation. Here’s how:
1. Go to the Series section in the side bar and select the checkbox beside Error Bars.
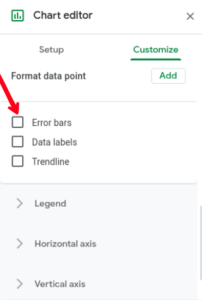
2. You can then choose Constant, Percent or Standard Deviation from the drop-down list.
3. Next, input the value you prefer to use.
And voila! Your chart will show this error bars at the right sides of the bars.
Rounding Up…
Google Sheets helps you make bar charts, but more than that is the customization it offers. The customizations are really helpful in that they allow you tweak your chart to your taste and it’s so simple to do. We hope you found this guide helpful? If you did, kindly leave a comment and don’t forget to share…